For more information on the features of our BI module, click the image below to view our eBrochure
Reporting incidents, creating Risk Assessments, Auditing processes… The list goes on.
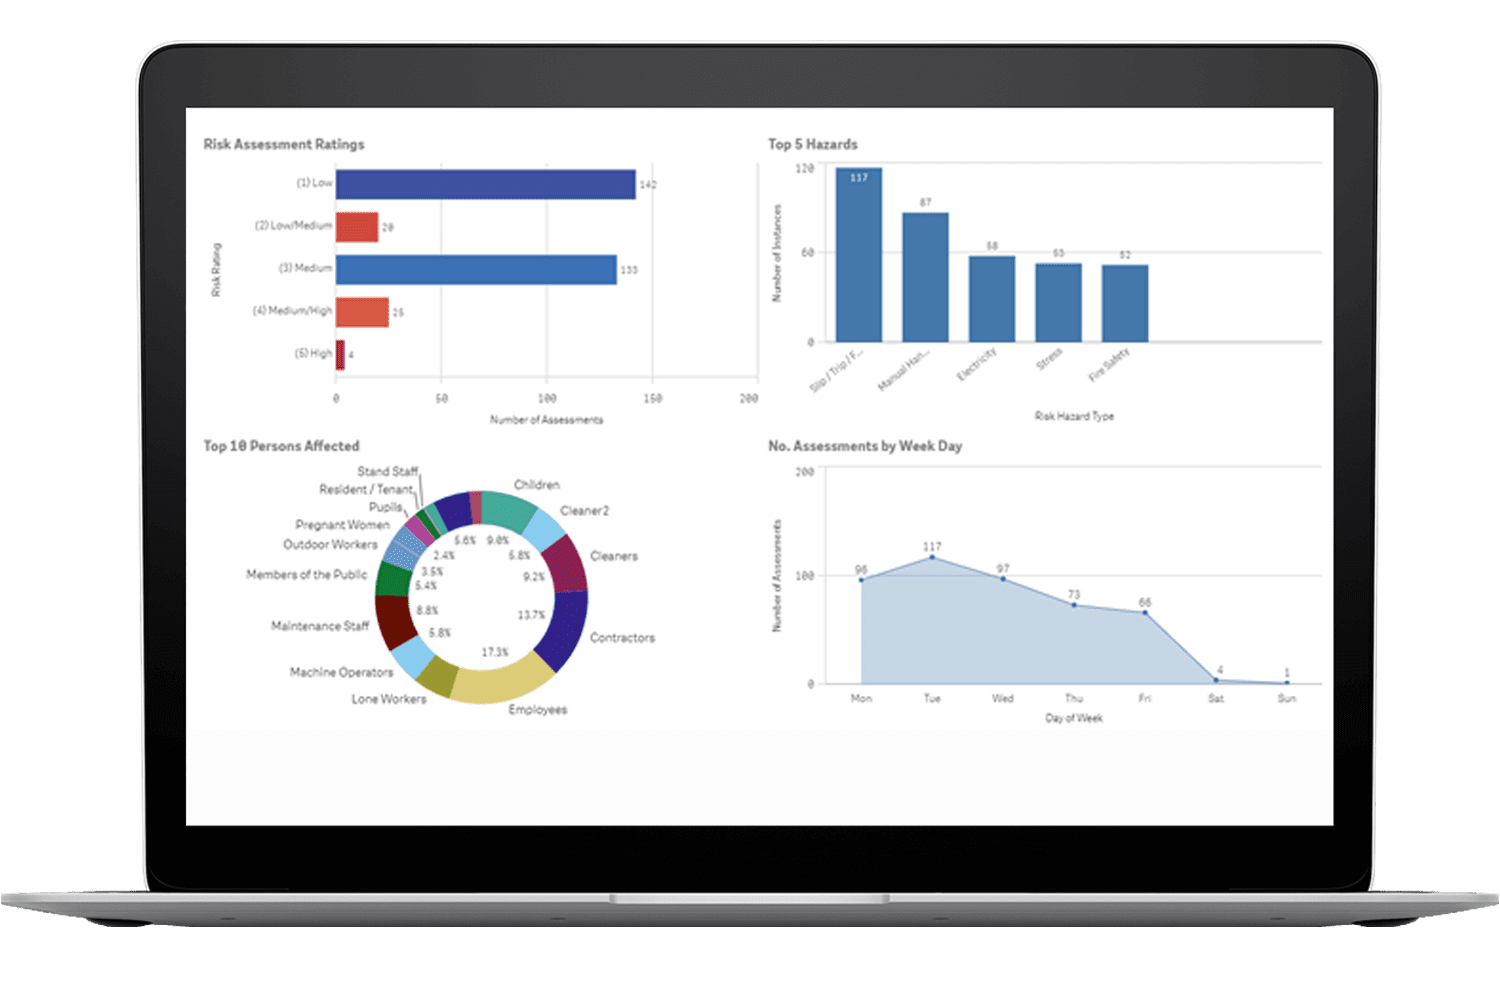
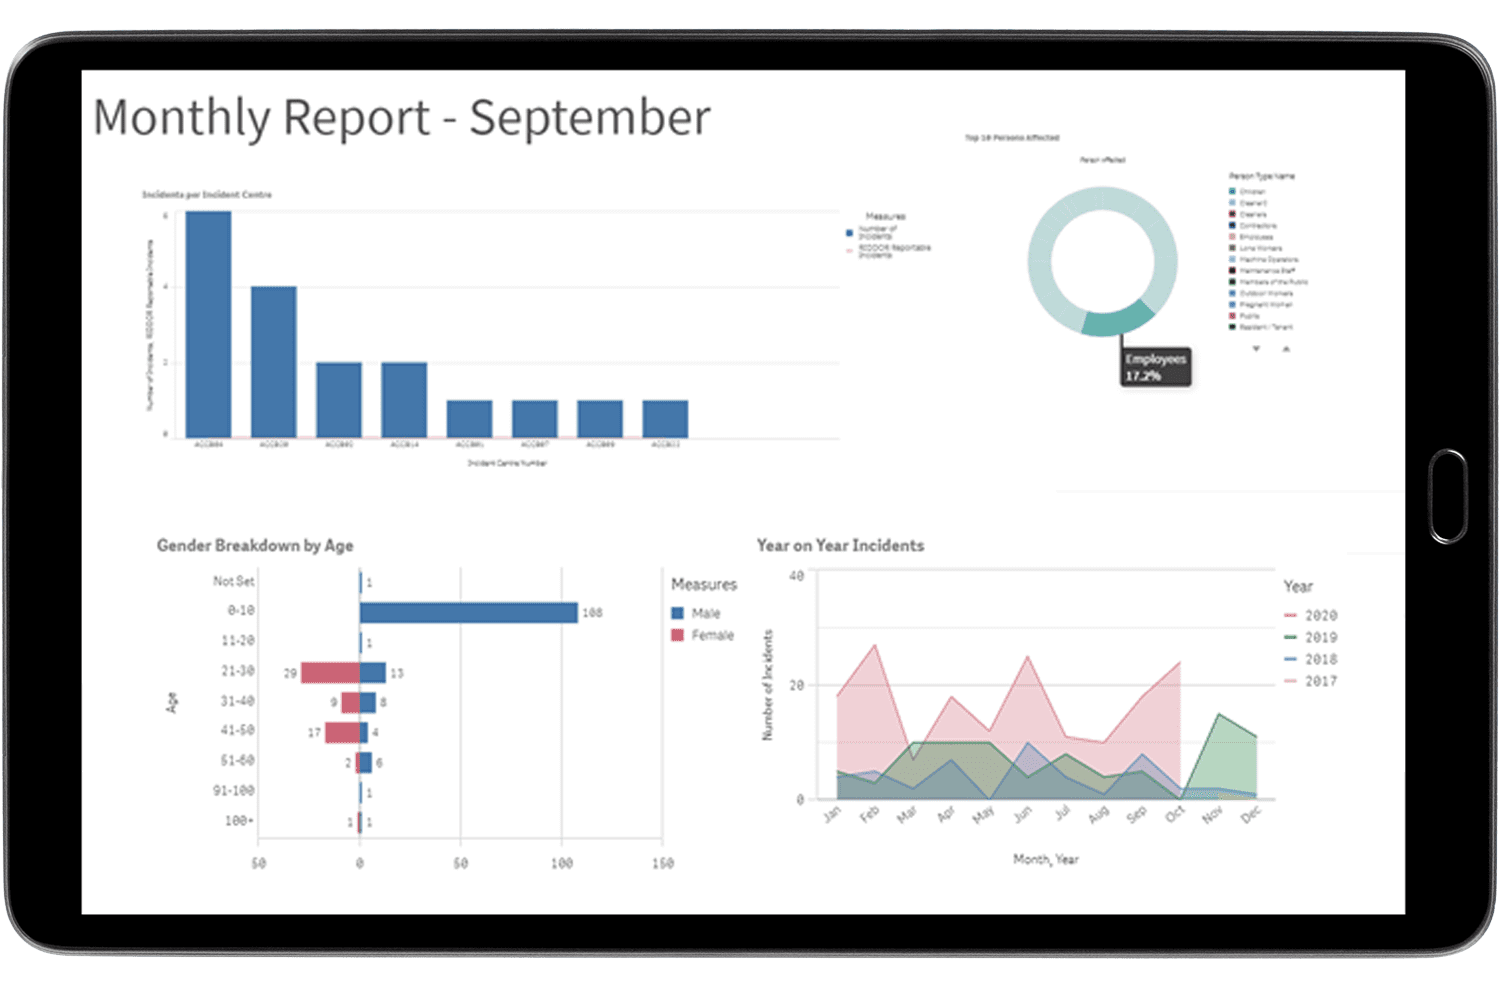
With so much activity, do you fully understand your organisation’s current level of compliance? What trends are appearing in your incident data? Where do you need to focus resources? AssessNET’s Business Intelligence (BI) analytics engine solves these queries and many more by displaying your data in a simple visual format, with comprehensive dashboards, charts and tables.
Build the insights your organisation needs:
- Select from the suite of sample charts and visualisations or configure your own with a member of our team
- Use the storytelling feature to take snapshots of visualisations and compile them into presentations directly within the module
Drill down into your data:
- The Analytics Engine brings drill-down capability directly into AssessNET. Use filters or select data points in charts to interrogate your data
- Filters that are set apply to all associated charts, giving a granular view regardless of the selections
- Compare filtered data by using the built-in filter memory
Export when needed:
- All charts and visualisations can be exported in several commonly supported formats
- Present your organisation’s data directly from within AssessNET or export compiled presentations to PDF or PPTX for offline use
- Export raw data to use off-line or within other analytical tools
Key features of our BI module
Unlock valuable business insights from the data held in AssessNET, to help your strategic decision-making
Use an ever-expanding suite of charts and data visualisations to present analysis to stakeholders
Data storytelling – Assign context to data whilst also accessing the original analysis
Link back to records in AssessNET to complete the analysis cycle
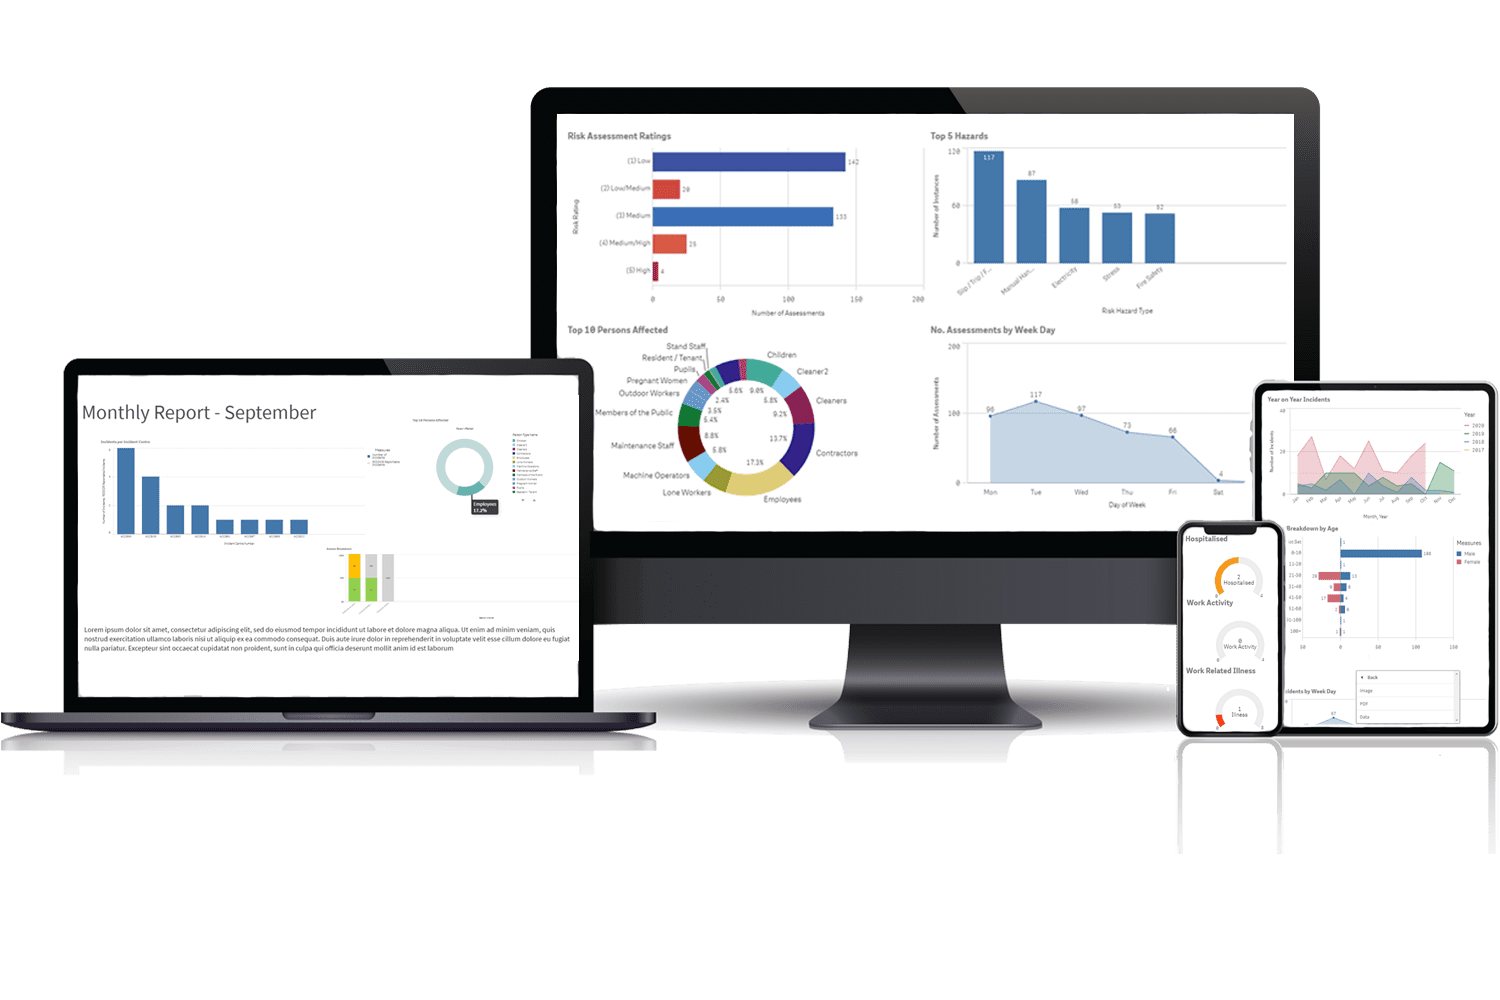
View responsive content, with charts and visualization layouts automatically changing for the best presentation on any device
Access a variety of subscription packages for bespoke data visualisation


