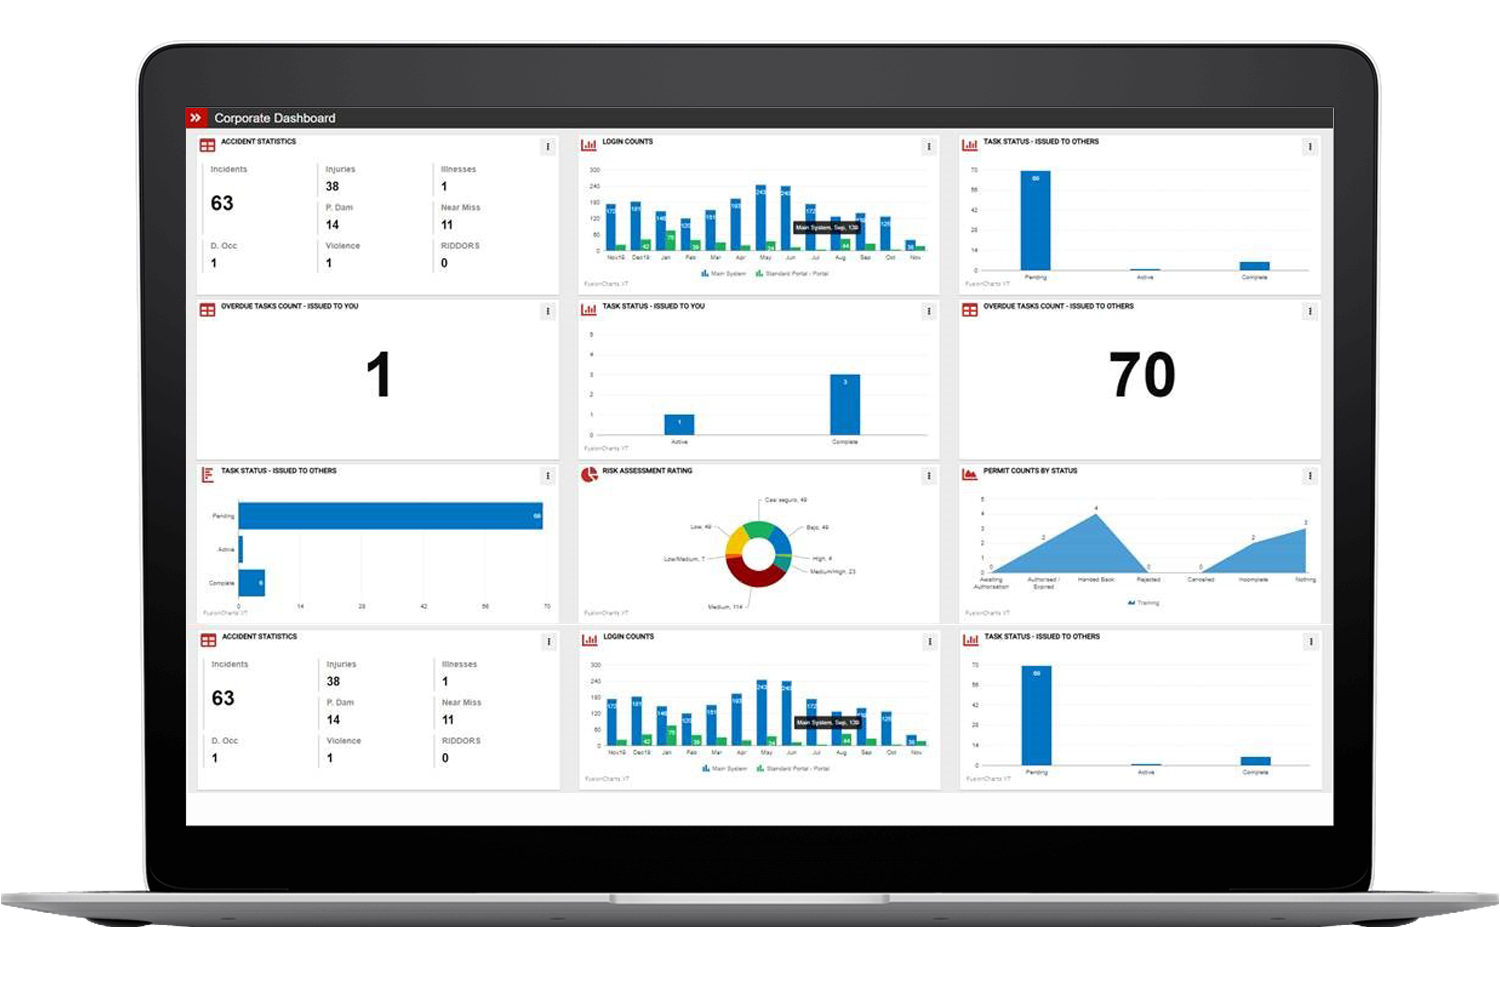
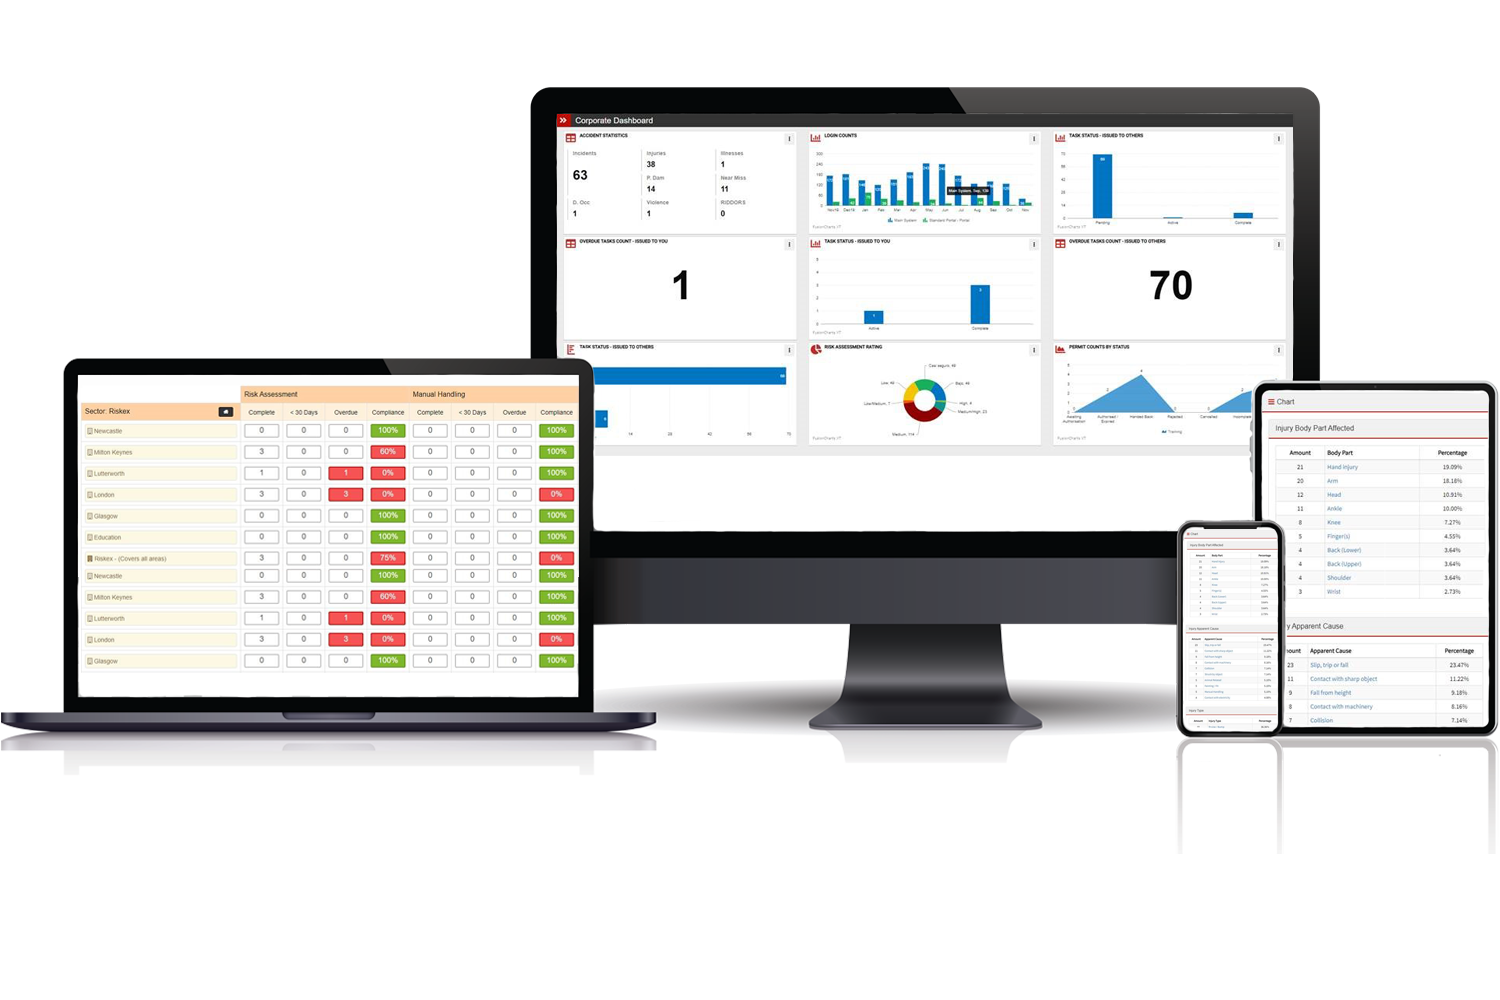
Each of AssessNET’s modules provide a high-level set of Key Performance Indicators to quickly see how your system is being used and to highlight areas of non-conformance within your organisation.
Comprehensive analytics are available for modules such as Incident Reporting or Audits, or a BI interface can be configured for more in-depth analysis.
Overview of your data at source:
- Quickly identify areas of non-conformance and get to the source of issues within your organisation
- Drill-down into the data by location, giving multi-level statistics in one place
Configurable dashboards:
- Set up your own dashboard using the pre-defined chart options
- Datasets provided for several core modules within AssessNET
- Filter charts individually, limiting date range and scope of the data to target specific areas
- Provide a side-by-side comparison of similar data by duplicating chart criteria
- Choose from a suite of chart styles to help highlight data as you need it
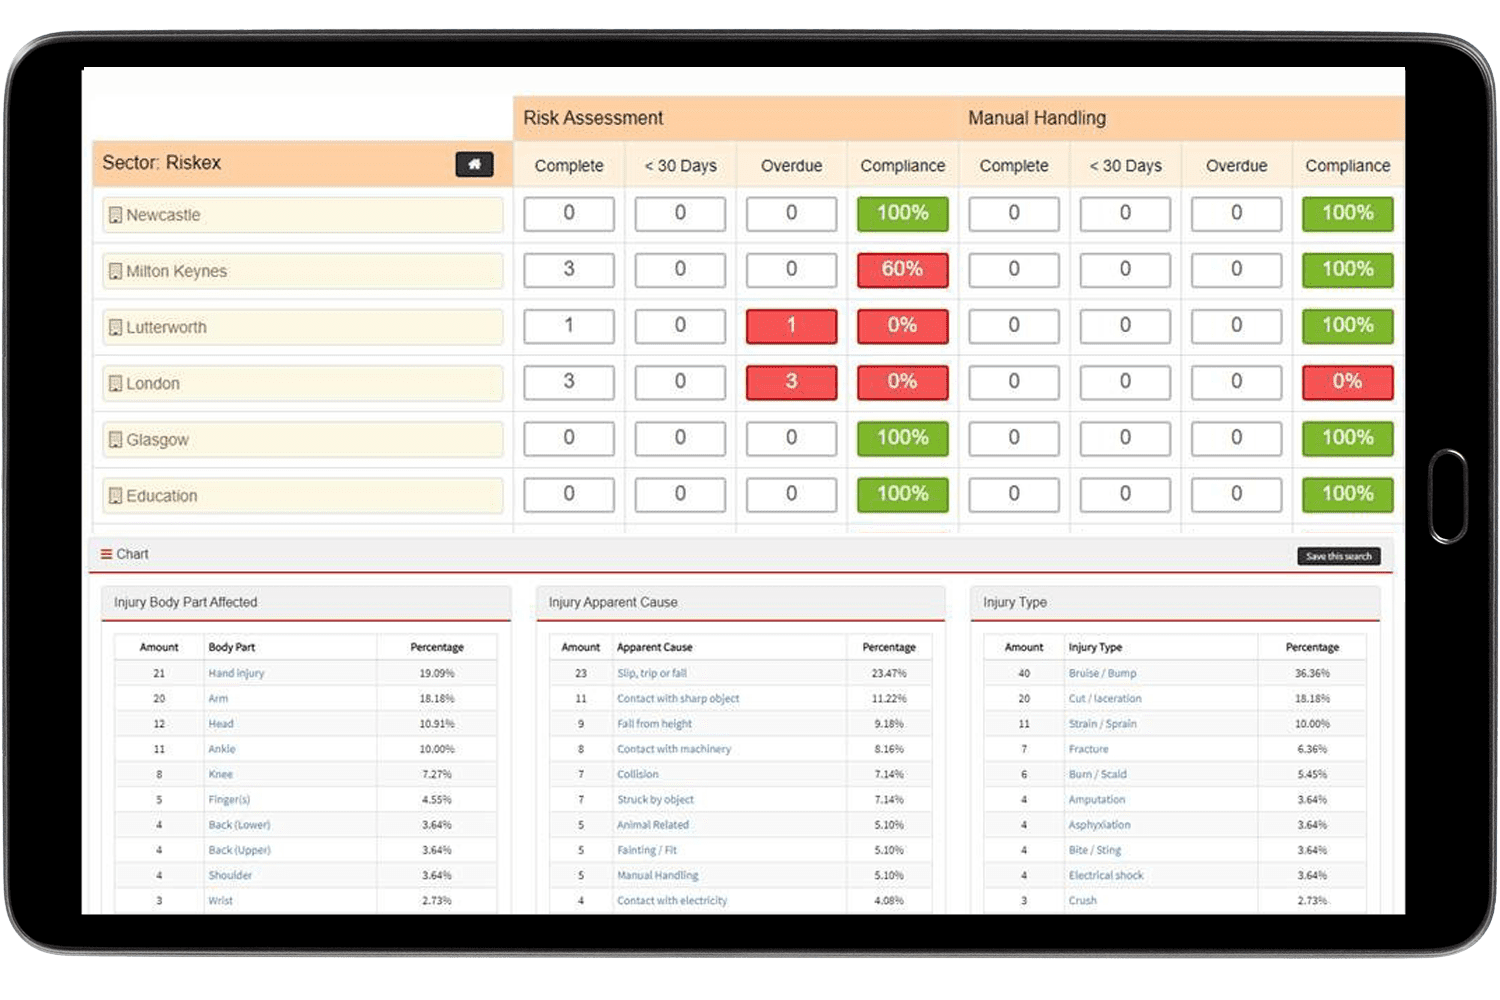
Tabular overviews:
- Use the tabular overviews to show assessment, audit and incident statistics, colour-coded to highlight areas of concern
- Drill down into your business structure to find the source of non-compliance
- Export raw data to use off-line or within other analytical tools
Key features of our Dashboards and Reports
Colour-coded KPI’s to visually identify positive and negative compliance
Pin KPI tiles to your homepage (coming soon!)
Comprehensive analytics for Incident and Audit modules
Configurable charts
Drill-down reporting
Upgrade available to advanced BI Analytics


